 |
Anthony G Booth | 12 October 1988 |
Delivered to the International Association for Cybernetics
at the 12th International Congress on Cybernetics
Namur, Belgium
August 1989
Processes of coding or naming things by means of unsupervised learning seem to cheat the rules of statistical information in the sense that they take advantage of structure in the given data to improve economy of the adaptive solution. This is true even when the fixed set of data vectors are merely randomly generated.
The object of the demonstration is to show how this margin of information economy can be sufficient to drive the process of self adaptation in an elementary machine.
A neuron-like process is simulated by a computer program such that the adaptive states can be seen progressing towards improved values. Its performance is derived in terms of the ratio of wanted to unwanted statistical variances at the output.
Anthony G Booth | 12 October 1988 |
In the usual descriptions of a channel conveying information the basis of signal interpretation by the receiver is assumed to be given a priori. However there are many circumstances where a given signal may be usefully classified or described by an observer with no special basis for such classification, indeed even when the signal was not expected. It is true that the classification which results is in some respects determined by the particular state of the observer system before the observation, but this does not rule out the value from such classification. It is possible for such a spontaneously formed classification to identify interesting features in the given set of signals and they can be very complex.
These effects can be arranged to have very practical value because of the autonomy with which such processes operate. They do not need to be explicitly programmed as is the case for deterministic and logically specified signal processors.
The objective here is to establish a general framework within which the process of classification can be made to occur mechanically, and to try to establish a measure of performance akin to the usual ones used in information theory.
Consider a set of subject signal points characterised by a scalar density distribution function in a signal space of high dimensional order.
Our objective is to create a classification of the regions of the signal space in such a way as to make an efficient coding of the signal point possible. The following matters relate to this.
| 1) | It is necessary to set some limits upon the presumed range of possible values which the signal can take, i.e. to place some outer bounds on the signal space, before quantification of coding efficiency can be established. |
| 2) | Also it is necessary to acknowledge some limitation to the accuracy with which the subject signal will be determined, for without it the amount of information required to express the signal value is infinite. This limitation might take the form of an error of observation or it might be determined by an a priori assumption on the part of the observer whereby accuracy beyond a certain degree yields little value. The magnitude and form of the region of indistinct value may itself be a function of the signal value. In many useful cases it is just constant and spherical in a Euclidean signal space. |
| 3) | The density function is not given per se, but rather is to be estimated from a population of signal points. For a first approach consider the case where the number of points in the given set is so many that there can be no shortage of data with which to establish the values of the density function. This is based upon having enough points to represent a reasonable sample within each region of indistinct signal value. |
| 4) | Some sense of proximity must exist at least in order that the classification regions in the subject space have a degree of useful cohesion. A minimum degree of effective proximity is brought about by the existence of a region of indistinct value of the subject signal, because points within this region are of effectively equivalent value. Further, if the distribution function of the subject signal is deficient in its degree of fine detail, i.e. contains relatively low amounts of high spacial frequency, then distinctness of regions of the signal space will be limited by this rather than the uncertainty of the subject signal value. (However for this to be so there must have been some form of assumed smoothing over sets of signal samples.) |
| 5) | There are two stages to the design. The first consists in establishing the dimensional order of the object space in which the code is to be expressed as a signal. The second consists in selecting a realisable mapping which will serve to generate the code vector in the object space from any given subject signal point, and this will usually need to be non-linear. Our objective is to make the first of these stages manual (extrinsic) and the second automatic (intrinsic) and dependent upon the actual data. |
| 6) | For signalling schemes where the expected signal strength is uncertain the information must be largely in terms of the direction of the vector in the Euclidean sense, and not the magnitude. This is so for both subject and object signals. |
Any definitive description of a particular probability distribution must correspond to selection from a hypothetical set of possible probability distributions. Without existence of such hypothesis, at least implicitly, the process of description and hence of design cannot start. In particular it is not possible to distinguish value in terms of entropy until a basis in such a hypothetical class of distributions is established. For a given overall subject signal space the basis of hypothesis may be varied for example according to:
| a) | the minimum distance usefully distinguishing two points in the signal space, |
| b) | the maximum magnitude of each signal vector element, |
| c) | the limits to form of partitioning of the signal vector (factorising the signal space) |
| d) | the limits to form of partitioning of the signal space into sub-spaces. |
The objective here is to distinguish a stage in the process of design to do with hypothesis generation. This is in order to raise the level at which general and specific matters are separated so that the resulting machine can solve a more general class of problems.
It is possible to start out with a range of hypotheses, and then to select from these a working hypothesis against which to perform entropy assessments. The quality of a particular selected class of distributions derives from its economy of expression of the range of possible signal distributions which will be encountered in the future.
With its potential for superposition of signals and low loss of information it is important to consider linear mapping as a means of processing the signals. However for a given signal space there could not be a further layer of design structure if the objective were merely to arrive at a linear filter. Rather the additional option for structuring must lie in the partitioning of the given set of signal elements under separate centres of detection (i.e. non-linear processing) which then allows linear processing to be used within each partitioned group.
The selection of such groupings serves to establish the hypothetical class of distributions amongst which an adaptive solution will subsequently be sought. Such groupings may need to have limitations to their complexity if practically effective results are to be achieved, but there is no reason why any given signal element should not be transmitted into any number of different processing groups.
Real world signals are often redundant in their use of variance in that there is often strong correlation between the elements of the signal vector. (Temporal correlation will be omitted here, but yields to a similar analysis.)
In large arrays such as retinal or cochlear sensors there are often strong correlations to be found amongst certain groups of signal elements, whilst it is not so in general between other pairs of elements. For example the pixels physically close to one another in a retinal sensor array might be expected to tend predominantly to take dot, line and corner forms in arrays of some tens of elements, whereas there might be no such tendency observable over larger groups. This could either be because of the massive number of possibilities which would need to be handled in the expression for wide groups of pixels or just because these forms do not predominate in the larger scale. This effect may be regarded as a form of syntax amongst groups of elements of the signal.
Given a signal vector which either does not contain opportunity for grouping on a syntactic basis, or else is only one of such groups derived from a larger vector, then it is still common to find that the occupancy of the various regions of the signal space is strongly non-uniform, and this form of redundancy represents a semantic type of structure.
The aim here is to find automatic ways of extracting the latter semantic form of structure from a given set of signal points, but without insistence upon any particular set of resulting codes.
In particular we are interested in classifying signals according to their vector directions, because the transmission media commonly encountered are liable substantially to distort the signal in its magnitude.
For a linear mapping with coefficients incoherently selected from a population with Gaussian distribution the elements of the object vector have themselves a Gaussian distribution of values. The ratio of variance to squared mean of the object vector norm (mean taken over a number of unit norm signal vectors) is inversely proportional to the number of elements q in the object vector. Thus as q increases the proportion of the object points found within a sphere at the origin with a radius which is a constant small proportion of the object vector mean norm decreases approximately in proportion to the exponential function of -q.
This is useful in visualising the frequency with which unusually diminutive vectors with consequently ill characterised directions will result under a random linear mapping as the order of the object vector is increased.
Consider a linear mapping. Take the average contribution of mapping coefficient variance needed to set up the transformation of each distinct unit norm input vector to some corresponding prescribed unit norm object vector as unity. Then the corresponding average contribution of variance needed to correct a random mapping of a similar single term to its nearest equal element object vector is only 0.404 times as much. This figure is the mean of the Gaussian weighted squared difference of the variate from unit magnitude (+ or - as the case may be).
This indicates that the set of coefficients in a given mapping can serve to control with reasonable accuracy the mapping of about two and a half times as many signals on this basis as would be so for the simple linear mapping system with prescribed object vectors.
If the variance contribution is spread across an even greater number of signal terms than this then the corrections can only be partial, so that substantial residual errors must be present. However, the expenditure of coefficient variance for a given amount of net reduction in object vector squared error becomes smaller in proportion to the square of the factor of spreading until the limit is reached due to the finite number of equal element object codes. Thus there is a trade-off possible by cascading networks with a reduced degree of signal improvement in each stage so long as a non-linear decision detection process can be found which does not destroy the gain so made.
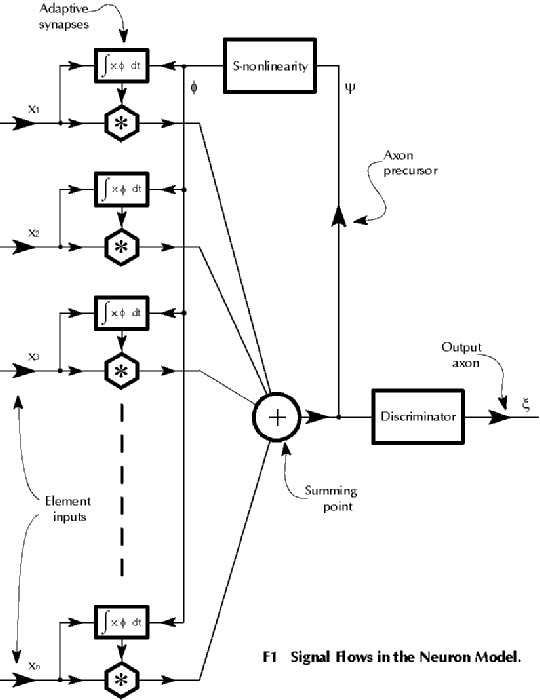
Consider a single neuron with a synaptic bias vector s of order n spanning the n-space S. Refer to diagram F1.
|
The neuron function is arranged to bring the mean square bias of the synaptic elements to a moderate value. This is done by using an S-shaped transfer characteristic mapping ψ to φ in the path of adaptive action driving each synapse. See graph G1.
 |
The adaptive action is achieved by multiplying the incoming signal element by the non-linear feedback from the axon precursor and using the result to apply a small adjustment to the respective synapse weight.
The neuron may be viewed as a data processing device which operates dynamically upon the data presented at the inputs x1...xn to its synaptic multipliers. The objective of adaptive action is to map inner products of the vector s and each of k data vectors of order n to an output as closely as possible to unit magnitude, but allowing either sign. These k signs are to be chosen so as to minimise the mean square deviation of the k scalar results at ξ from unit magnitude, and the non-linear adaptive feedback serves to move the value of s towards such a state. All of this is aimed at allowing the use of an element-wise non-linear operation such as a level discriminator to enhance the information at the output ξ (at the axon).
The set of data consists of k elements, each of which is a vector of order n, so the data may be represented as a matrix D of order n by k. Thus alternatively one may use a static data model of the adaptive process in which the data set is viewed as a constant, by virtue of its stationary statistics, so long as the adaptation rate is kept low enough.
Using this static model for the single neuron the synaptic state space S is mapped by the data matrix D onto the n-space P which is a factor space of the output k-space Q. Seen in these terms the objective of adaptation is to adjust s so that the point p is brought as close as possible to one of the unit cuboid vertex values in Q, i.e. where the basis elements of q are of unit magnitude, but of freely selected sign.
To feed the adaptation process the synaptic vector s is mapped by D either using the various columns of D uniformly as might be the case for a synthetic learning sequence, or else according to some form of column-wise weighting as might correspond to a random programme such as would be imposed by a real world learning sequence.
For a first analysis it will be imposed that the data vectors are all of unit norm, and are randomly chosen and not particularly mutually orthogonal.
Then so long as n and k are both reasonably large, and k is substantially greater than n (please forgive the lack of clarification of "reasonable" and "substantial" within the limited space of this paper), then D maps S onto P, and P is a factor space of Q with order which is very unlikely to be less than and cannot be greater than n. By virtue of the randomness of the elements of D, this factor space is to be taken as having arbitrary orientation with respect to the basis of Q.
There exists another matrix A (not unique) with k-n columns of k elements which maps each point q in k-space Q to the complementary factor space R of the space P of feasible outputs under the given data matrix. Each column of A must have unit norm in order to map distance without change of scale. The norm of the vector q.A in R is the distance of q from the nearest point in P.
We are interested in finding thermodynamically economical points in Q (i.e. with small normal distances from P), which have all their basis projections of unit magnitude.
The distribution of such distances can be assessed as follows. The order of vector q is k, and the set V of points we are interested in are vertices of unit edged polygons in Q, and therefore each has a norm of √k. There are 2k of these vertex points in V, and the distance from P of each such point v is given by the norm of the product v.A.
The individual elements of the vector v.A may be expected to take a distribution of values which is Gaussian with zero mean and unit variance (Do the sets of elements which compose these vectors behave as though independently sampled from this simple population?). Thus the norms of this set of vectors formed by mapping the points in V by A is distributed as the k-n dimensional superposition of one dimensional unit Gaussian distributions. The consequence is a Gamma distribution with mean √(k-n) and variance equal to 2/√(k-n).
Thus the possibility of finding solutions to this unsupervised learning problem (i.e. adaptive end points and optima) can be studied in terms of the probability density in the lower tail of this Gamma distribution. Also these probability densities form a basis for models for the assessment of adaptation (annealing) rate.
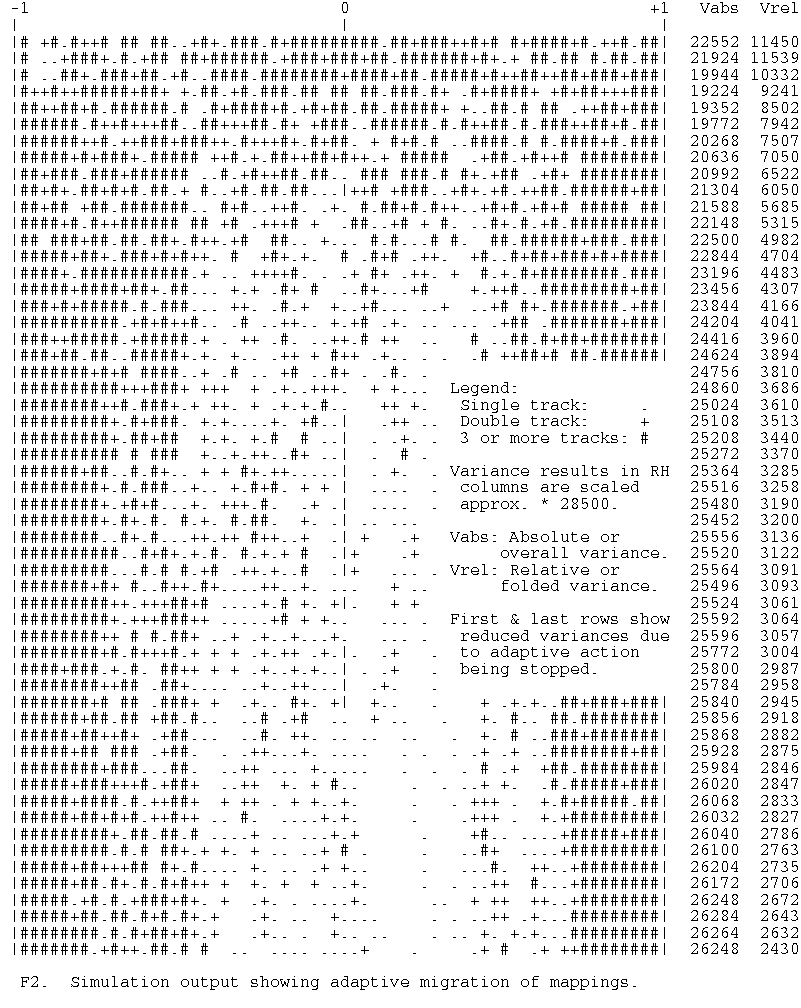
Tests by simulation of a neuron with 128 synaptic inputs illustrate the nature of the self adaptive process of code generation.
The operational signal mapping produced by a single neuron is depicted in diagram F2 where a binary classification of 256 input data elements is shown developing from a random starting condition. The tracks of adaptive movement of the respective mappings of the different input vectors can be clearly seen at the edges of the main clusters around +1 and -1. This diagram shows only the region between the two clusters, and not the outer fringes.
The simulation is according to the signal flows of diagram F1, and the non-linear adaptive rule is based upon an S-shaped function according to graph G1 having zeros at -1, 0 and +1. It can be expressed in the form φ = -katanh(1.4ψ(ψ+1)(ψ-1)) .
The simulation run leading to the results shown is based upon fixed point arithmetic. The synaptic weights are manipulated as signed sixteen bit numbers. The non-linear mapping of the adaptive feedback is expedited by means of table lookup with a signed eight bit result. The data is restricted to vectors each with 128 elements of unit magnitude and random signs. Adaptive gain is controlled by shifts to achieve rapid multiplication. As a result the correction terms can be rather small, and this leads to quantisation effects which ultimately become visible in the operation of the model. However this does not dominate in the case of the run shown in F2.
 |
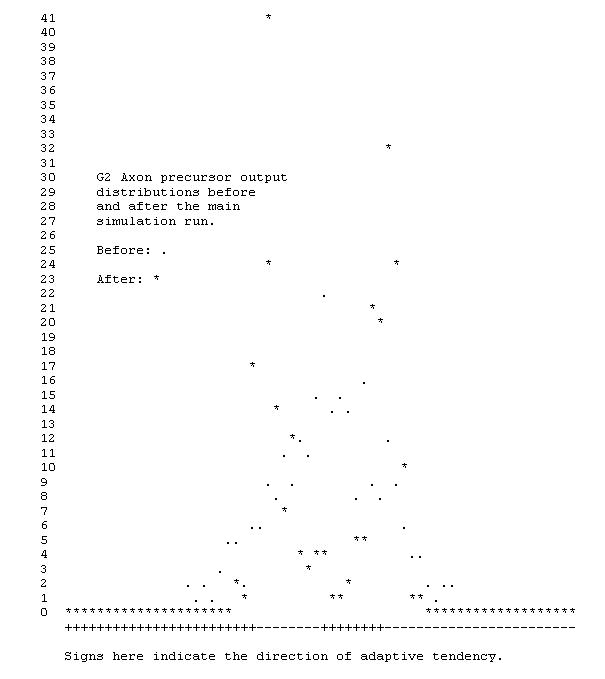
Graph G2 shows the relative distributions of the linear mapping over the set of 256 signal points both before and after adaptive operation on 55 cycles of the entire data.
 |
To demonstrate that the encoding process can be used to formulate greater detail than a single binary classification additional statistics are given in table T1. The original plus three further similar classifications differing only in their arbitrarily different initial synaptic weightings are compared.
Correlation results between these four simulation runs are also given in tables T2 and T3. The first of these tables shows the correlations at the linear summation point of the synaptic weighted signals, i.e. the linear precursor of the axon signal, and the second is the result of applying discrimination of this signal at zero threshold level to derive a binary axon output signal. The distinction does not affect the simulation since the adaptive feedback is from the precursor only.
|
Overall mean | Overall variance | Folded mean | Folded variance | Central density | ||
| 0.10839 | 0.72949 | 0.68554 | 0.25951 | 0.4375 | Start of main simulation run. | |
| 0.08447 | 0.84057 | 0.87109 | 0.08177 | 0.12109 | End of main simulation run. | |
| 0.08789 | 0.82019 | 0.86035 | 0.07998 | 0.10937 | End of comparison run 1. | |
| 0.05419 | 0.82336 | 0.85937 | 0.08483 | 0.125 | End of comparison run 2. | |
| 0.02734 | 0.86157 | 0.87646 | 0.09338 | 0.09765 | End of comparison run 3. |
| 0 | 1 | 2 | 3 | Legend: | ||
| 0 | 1 | 0.0405 | 0.0762 | 0.1464 | 0 Main simulation run. | |
| 1 | 1 | -0.0171 | 0.0374 | 1 Comparison run 1. | ||
| 2 | 1 | 0.0478 | 2 Comparison run 2. | |||
| 3 | 1 | 3 Comparison run 3. |
| 0 | 1 | 2 | 3 | |
| 0 | 1 | 0.0313 | 0.0859 | 0.1563 |
| 1 | 1 | -0.0234 | 0.0000 | |
| 2 | 1 | 0.0547 | ||
| 3 | 1 |
The creation of random codes could be achieved merely by using random settings of the synaptic biases without adaptation, as is the case at the commencement of the adaptive simulation run. However the distribution of output values from the linear summation process is then Gaussian, and as a result the density of these which map near to zero is a peak value close to 0.4. After adaptive adjustment the distribution of the linear sums is bimodal as shown in G2. The criterion of quality of the results may be expressed in terms of the purity of this bimodal form.
One such measure can be obtained by folding the distribution about zero so that -1 maps onto +1, and adding together the corresponding terms. The variance of the resulting distribution divided by the original unfolded variance indicates the degree to which the process has achieved clear segregation of the input vectors into two classes. In the simulation shown this factor turns out to be ten (refer to table T1). In signal processing terms the residual error of classification is at a level of about -10dB (-10decibels) which is about 5dB better than the figure achieved by using the original random mapping with no adaptive improvement at all (see the ratio of folded variance to overall variance in the first row of table T1).
This measure of performance indicates the ability of the encoding process to provide a sharp resolution of contentions between additive mixtures of two or three different input signals with differing magnitudes, or of encoding correctly with additive random noise of magnitude similar to the signal.
Where the resistance of the encoding process to small amounts of additive random noise is paramount then the relative density of the linear mapping to values near zero compared with the random case is best used. This is because it is the small mapped results which are then liable to corruption of sign and hence to errors of discrimination. For the case simulated here this works out to a factor of between three and four improvement, or about 5dB using the averaging interval from -0.5 to +0.5 (refer to table T1 and see how the central density for the last four rows is improved over the first row).
Subsequent related papers by the author:
| Phone +44 (0) 20-8679-6968 | e-mail see foot of AGB home page. | Last updated 29 July 2004 |
| Back to AGB home page. | Copyright © A.G.Booth 1988-2002 All rights reserved | |